
What is the Value of 1 Pi Crypto
March 15, 2026
The Graph and GRT The Google of Web3
March 15, 2026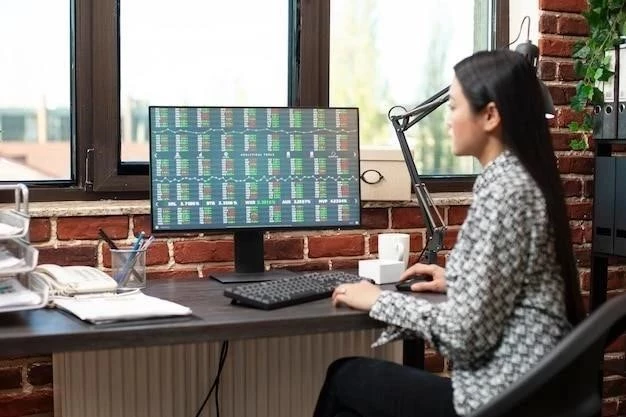
Crypto charts are indispensable visual tools empowering traders and investors to analyze price movements, identify trends, and make informed decisions within the volatile cryptocurrency market․ More than mere lines, they form a rich tapestry of data, reflecting market participant psychology; Mastering their interpretation is a cornerstone of successful digital asset trading․
Why Crypto Charts Matter
Operating 24/7 with rapid price fluctuations, relying solely on news or sentiment is risky․ Charts provide historical price action, offering crucial insights into past performance to hint at future possibilities․ They serve vital functions․
- Identifying Trends: Spotting upward (bullish), downward (bearish), or sideways (ranging) movements with clarity․
- Pinpointing Entry/Exit Points: Determining optimal buy or sell times, maximizing gains and minimizing losses․
- Risk Management: Setting stop-loss orders and profit targets via technical analysis․
- Understanding Market Sentiment: Gauging overall investor confidence, fear, and speculative interest․
Key Components of Crypto Charts
While various chart types exist, the most prevalent and informative for cryptocurrency analysis are:
Candlestick Charts
The gold standard, each “candlestick” represents a timeframe (e․g․, 1 min, 1 hr, 1 day) and encapsulates four crucial pieces of information:
- Open: The price at which the asset first traded during that period․
- Close: The price at which the asset last traded during that period․
- High: The highest price reached within that period․
- Low: The lowest price reached within that period․
The “body” of the candlestick indicates the open and close prices, while the “wicks” or “shadows” extending from the body show the high and low․ A green (or white) body typically signifies a close higher than the open (bullish sentiment), while a red (or black) body denotes a close lower than the open (bearish sentiment);
Line Charts
Simpler than candlesticks, line charts connect only the closing prices over a chosen period․ They offer a quick, unobstructed overview of general price trends but lack the detailed open, high, low, and close information essential for in-depth analysis․
Essential Technical Indicators
Technical indicators are mathematical calculations based on historical price, volume, or open interest data, typically plotted on or below the main price chart․ They help traders interpret market conditions and forecast future movements․
- Moving Averages (MA): These smooth out price data to identify trend direction and potential reversals․ Common types include Simple Moving Average (SMA) and Exponential Moving Average (EMA)․ Crossovers of different MAs are often used as buy/sell signals․
- Relative Strength Index (RSI): A momentum oscillator, the RSI measures the speed and change of price movements․ Ranging from 0 to 100, it identifies overbought (typically above 70) or oversold (typically below 30) conditions, suggesting potential reversals․
- Moving Average Convergence Divergence (MACD): A trend-following momentum indicator showing the relationship between two moving averages of an asset’s price․ It consists of a MACD line, a signal line, and a histogram, providing insights into trend strength, direction, momentum, and duration․
- Volume: Represents the number of units traded during a specific period․ High volume accompanying a significant price move validates the strength and conviction of that move․ Conversely, low volume suggests weakness or lack of interest․
Basic Chart Patterns
Recognizable recurring price formations on charts can often signal potential future price movements or trend reversals, offering strategic insights․
- Support and Resistance: Support levels are price points where buying interest is sufficiently strong to prevent the price from falling further․ Resistance levels are where selling interest is strong enough to prevent the price from rising higher․
- Trend Lines: Straight lines drawn connecting a series of successive highs (for a downtrend) or lows (for an uptrend) to visually represent the direction and strength of the prevailing trend․
- Head and Shoulders: A well-known reversal pattern, it typically indicates a potential shift from an uptrend to a downtrend (or an inverse Head and Shoulders for a downtrend to uptrend reversal)․
- Flags and Pennants: These are continuation patterns that suggest a brief, temporary pause in a strong, established trend before it resumes in the same direction, often indicating consolidation․
Reading Charts Effectively
Effective chart analysis requires a disciplined, holistic approach to extract meaningful insights:
- Start with the Big Picture: Always begin by analyzing longer timeframes (e․g․, daily, weekly) to understand the overarching trend and market structure, then zoom into shorter timeframes for precise entry/exit points․
- Identify Trends: Clearly determine if the asset is in an uptrend, downtrend, or a sideways (ranging) movement․ “The trend is your friend․”
- Mark Key Levels: Diligently draw and observe significant support and resistance lines, as well as trend lines, as these often act as psychological barriers․
- Use Indicators Confluence: Avoid relying on a single indicator․ Look for multiple indicators providing confirming signals to increase the probability of a successful trade․
- Consider Volume: Always check trading volume․ A strong price move on high volume is more significant than the same move on low volume, which could indicate a lack of conviction․
- Practice Patience: Wait for clear signals and confirmations before executing a trade․ Impulsive decisions often lead to losses․
While crypto charts provide invaluable insights, it’s crucial to remember they are not infallible․ The cryptocurrency market can be highly unpredictable, and external factors like regulatory news, major hacks, or broader macroeconomic events can swiftly override technical signals․ Always combine technical analysis with a fundamental understanding of the asset and, most importantly, practice sound risk management․ Never invest more than you can afford to lose, and understand that past performance is not indicative of future results․ By diligently studying and applying the principles of chart analysis, you can significantly enhance your ability to navigate the exciting, yet challenging, world of cryptocurrency trading․